
Maybe you mean: 'homepageslider' or 'hemp-slider' or 'africa-slider' or 'market-solutions' or 'mobile-homepage-slider' or 'mobile-hemp-slider'
Maybe you mean: 'homepageslider' or 'hemp-slider' or 'africa-slider' or 'market-solutions' or 'mobile-homepage-slider' or 'mobile-hemp-slider'
Overview | Trading | Index Pricing | Analysis
Frac Sand Indices
Pricing any physically traded product is a difficult task, as while the word “commodity” denotes a standardization, in reality, physical commodity transactions and supply chain management are anything but standardized.
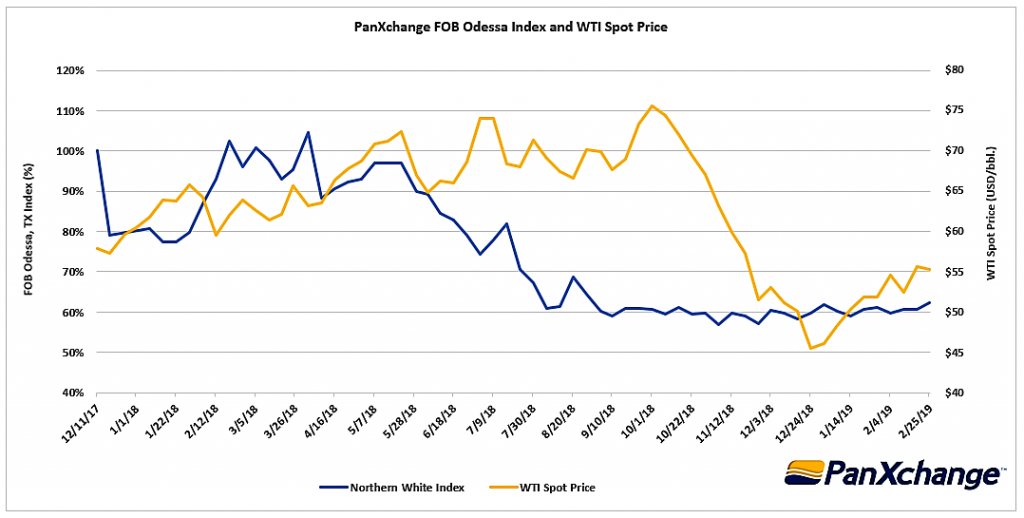
PanXchange publishes benchmarks based on type of sand and delivery location. Our current indexes include:
PanXchange Assessed Frac Sand Indices
- FOB Odessa 40/70 mesh
- FOB Kermit 100 mesh
- FOB Kermit 40/70 mesh
- FOB Wisconsin 100 mesh
- FOB Wisconsin 40/70 mesh
- FOB Wisconsin 30/50 mesh
- PanXchange Northern White Index
Why is Frac Sand Data Useful
Since the emergence of horizontal drilling, multi-well pads, and multiple pay-zones in stacked plays, rig count is no longer the best indicator to track future oil and gas production. Analysts are now watching the frac sand quantities used per well to gain the insight they need to predict future developments. The correlation between the amount of proppants used and the amount of oil and gas produced is reliable and straightforward.
Frac Sand Makes Up Around 25% of the total Input Cost for a Well, and around 50% of the completion costs. Accurate frac sand prices can be used as an input to financial models to create sound analysis and predictions.