All Articles
PanXchange® Sand: Benchmarks & Analysis 01.06.2020


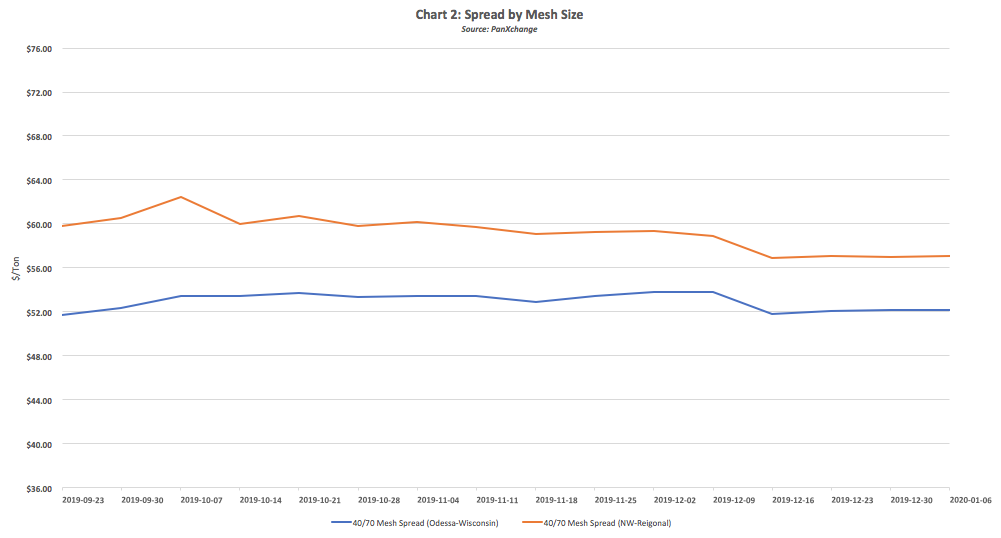
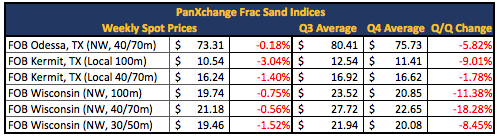
In the Northern White market, prices fell by approximately 1% this week across all mesh sizes (100m, 40/70m and 30/50m) to historical lows.
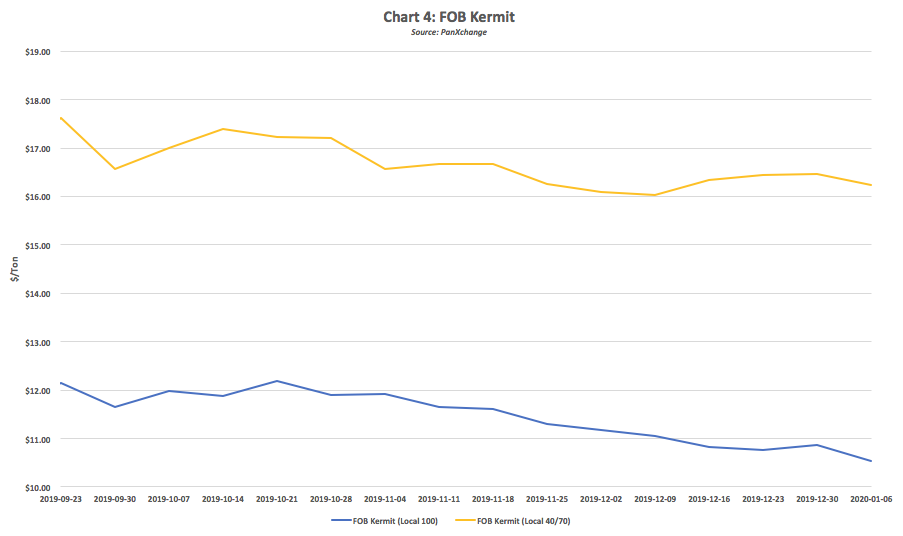
In the Permian, FOB Kermit 100m fell by 3.0%, local 40/70m fell by 1.5% and FOB NW Odessa 40/70m prices remained relatively flat. FOB Kermit 100m and FOB NW Odessa 40/70m reached historical lows this week.
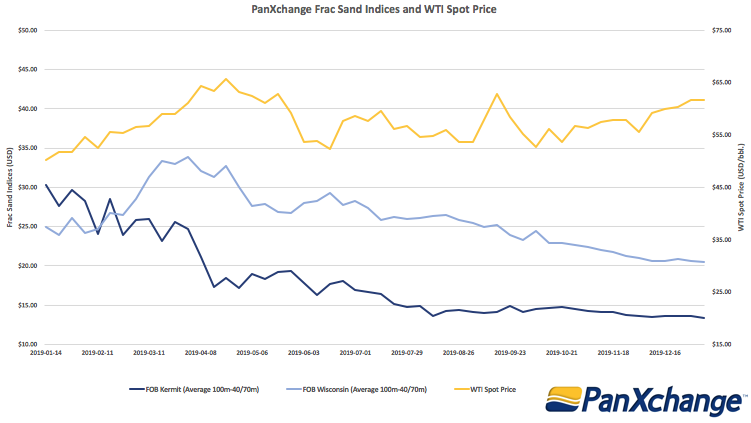
Despite oil prices being up approximately 25% from a year ago:
- The Primary Vision Frac spread count is down over 33% since early April
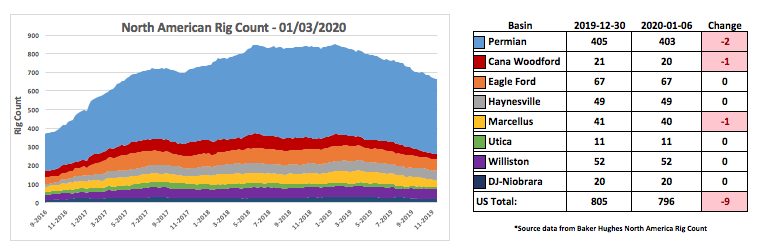
- US Onshore Rig Count is down approximately 25%
- Permian Rig Count is down approximately 15%
- E&P stock valuations are down approximately 10% (SPDR S&P Oil&Gas E&P)
- FOB Kermit 100m Sand Prices are down almost 60% due to supply growth
- FOB Wisconsin 100m Sand Prices are down approximately 20%
Although oil prices have been rising and these indicators are falling, we are working towards the light at the end of the tunnel with regard to frac sand demand. Unlike many other commodities, frac sand has an indefinite shelf life. This translates to a much more lagged response to a large oversupply as oil prices rebound. In order for the market to correct the supply glut for frac sand, there needs to be continued, strong oil prices to bolster activity and frac sand demand. It will be interesting to see if in 2020 there will be a continued market contango for oil futures, leading to a more synchronous relationship with E&P stock valuations, hydraulic fracturing activity, and the price of frac sand.